Timur Rizvanov

I build scientific software and machine-learning models for chemistry and biology: GPU-accelerated visualization of millions of cells, database-backed analysis that outgrows memory, and neural networks that replace quantum-chemistry calculations. Chemistry and Computer Science at Boston University, class of 2027.

Projects

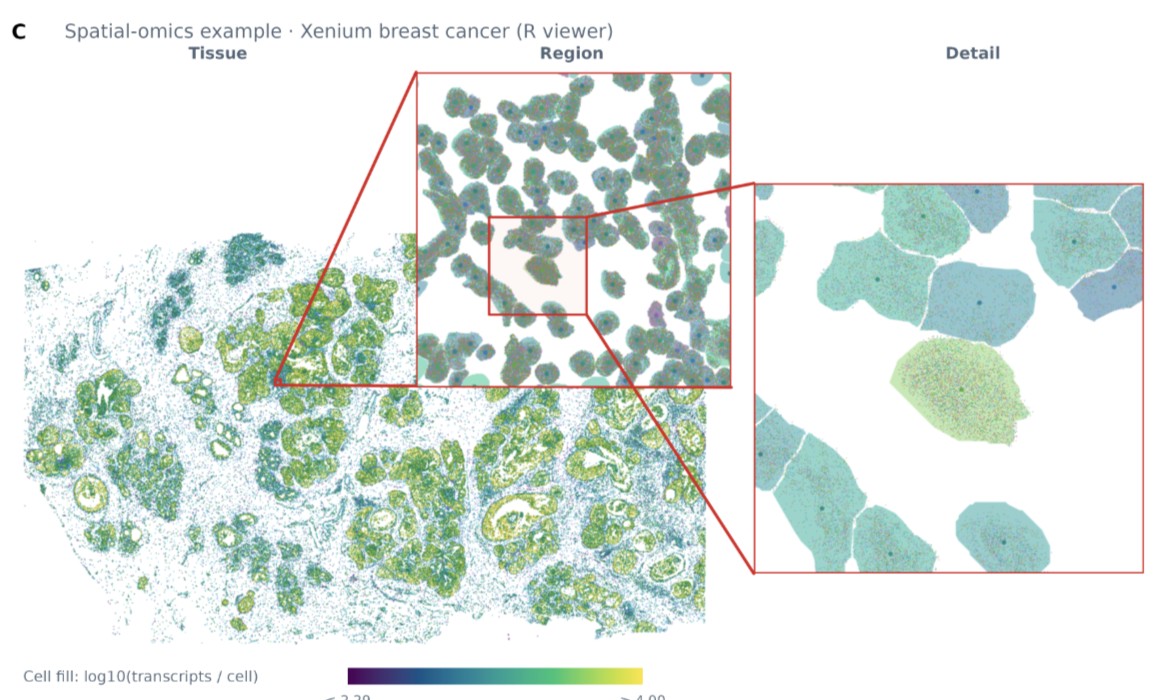
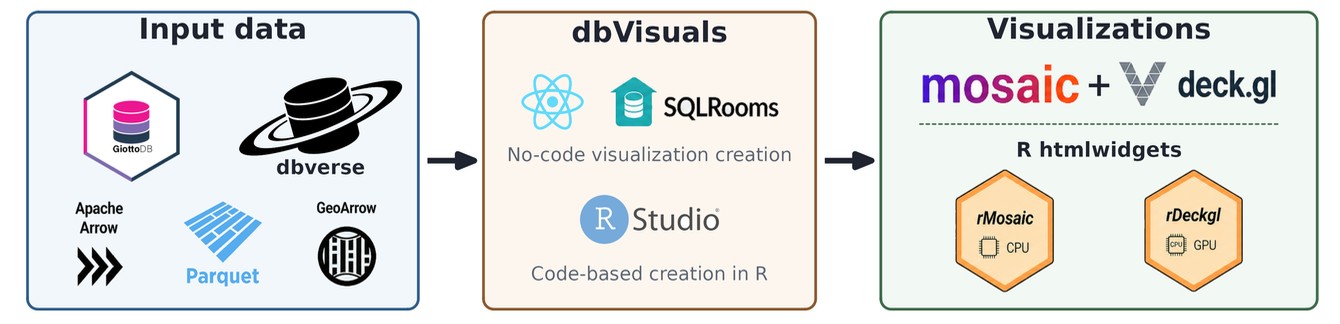
Xenium breast cancer tissue section colored by transcripts per cell, with Region and Detail insets at successively higher magnification that resolve individual cells Overview diagram: input data from GiottoDB, dbverse, Arrow, Parquet and GeoArrow flows into dbVisuals, with no-code creation in SQLRooms or code-based creation in R, and is drawn by Mosaic and deck.gl through the rMosaic and rDeckgl htmlwidgets

A Xenium breast cancer section in the R viewer, zooming from whole tissue down to single cells, and how the pieces fit together.

Lead author - R package

dbVisuals

Interactive, hardware-accelerated visualization for spatial omics in R. Queries run in DuckDB, results travel as Arrow, and the browser draws them on the GPU, so a tissue with millions of cells stays explorable on a laptop.

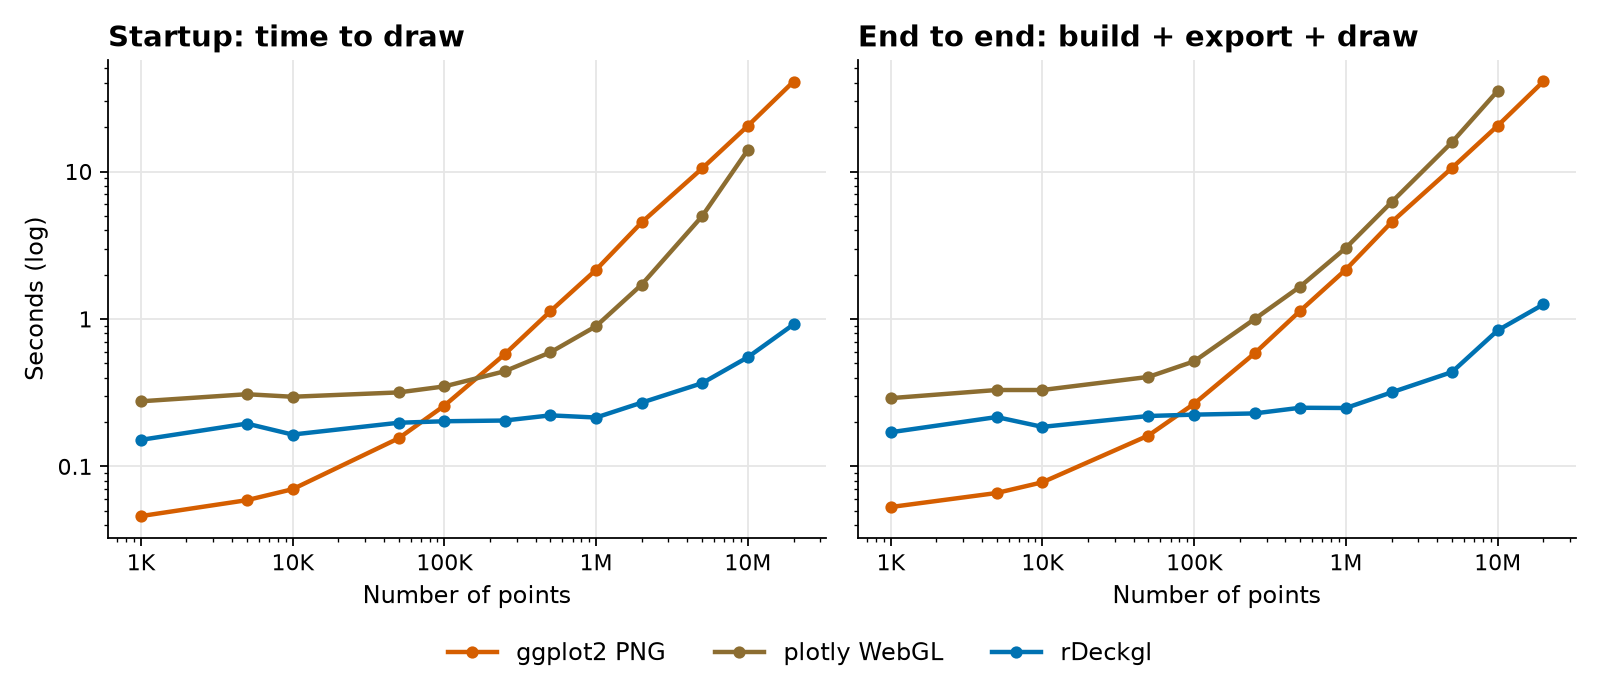
  • 2.5 s to draw 20 million synthetic points on a 16 GB laptop
  • 11x faster than a static ggplot2 PNG at that size
  • 4.1 GB peak memory across R and the browser, against 5.9 GB for ggplot2

RDuckDBApache Arrowdeck.glMosaicWebGL

Two line charts of seconds against number of points, from one thousand to 20 million, for ggplot2 PNG, plotly WebGL and rDeckgl: time to draw on the left and end-to-end time on the right; rDeckgl stays lowest from about 100 thousand points upward

Median time to draw (left) and end to end from a DuckDB file to a rendered view (right). End to end, rDeckgl with Arrow-file transport takes 0.25 s for 1 million points against 2.16 s for a ggplot2 PNG, and 1.26 s for 20 million against 40.82 s. Measured on development builds ahead of the CRAN release.

Author and maintainer - on CRAN

rDeckgl

R bindings for deck.gl. Describe a WebGL visualization as an R list, JSON or YAML, point its layers at SQL queries, and the package hydrates them through DuckDB and renders in an htmlwidget or Shiny app.

deckgl(spec, data = list(points = points))

# inside spec, a layer reads straight from SQL
data = list(type = "duckdb",
            query = "SELECT lon, lat, radius FROM points")

RJavaScriptdeck.glDuckDBShiny

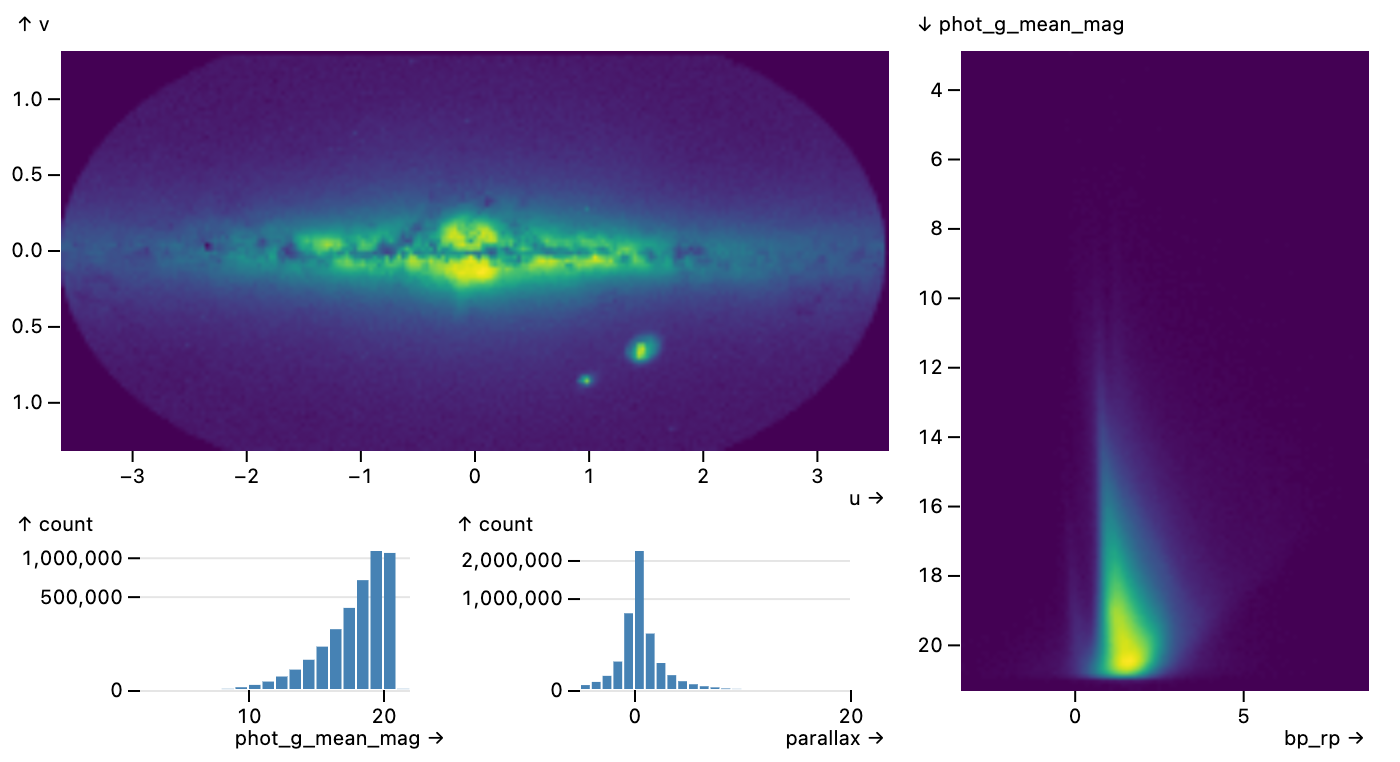
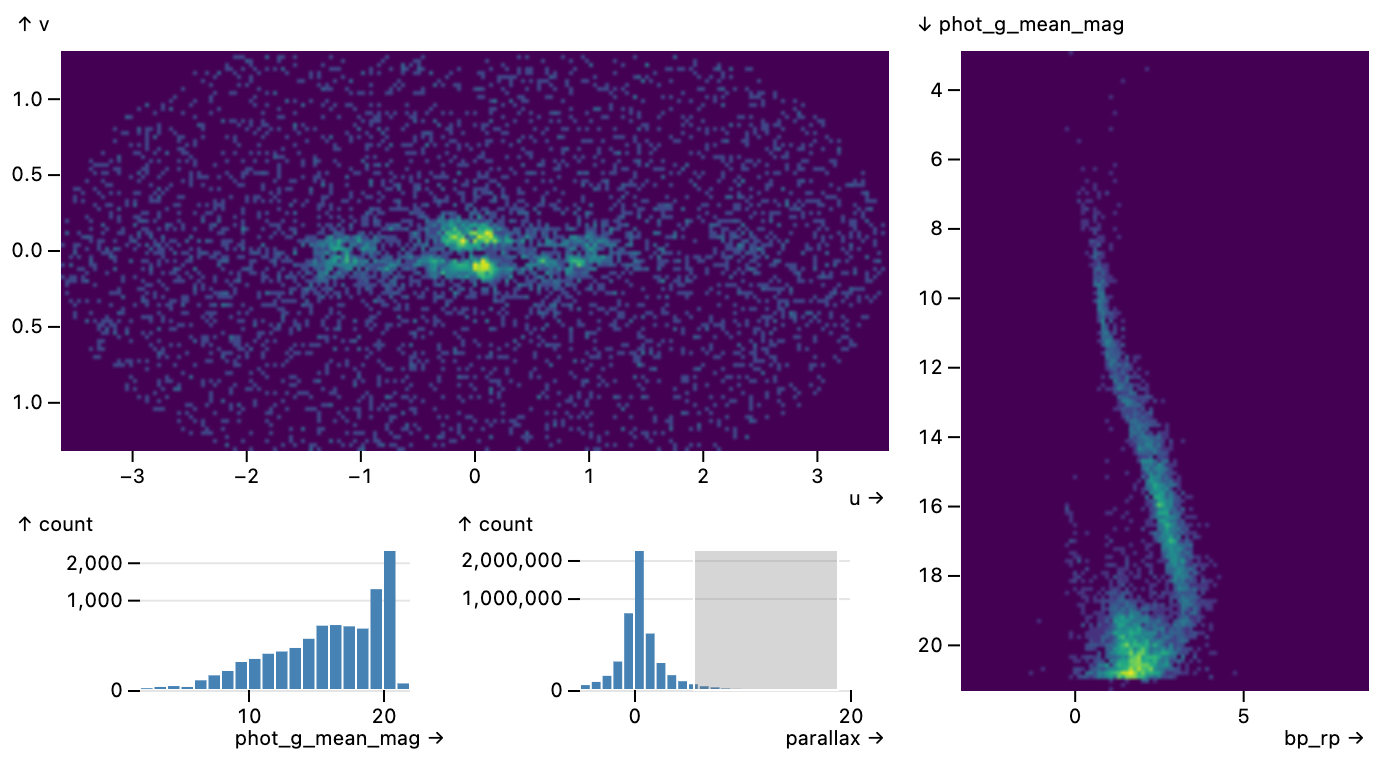
Gaia star catalog rendered by rMosaic: a density map of the sky showing the Milky Way, histograms of magnitude and parallax, and a color against magnitude density plot The same views after brushing high-parallax stars in the histogram: the sky map thins out and the color against magnitude plot resolves into a Hertzsprung-Russell main sequence

The Gaia star catalog vignette rendered by rMosaic: 5 million stars queried in DuckDB-WASM. Brushing the nearby, high-parallax stars in the histogram (below) cross-filters every view and brings out the Hertzsprung-Russell diagram on the right.

Author and maintainer - on CRAN

rMosaic

R bindings for the Mosaic declarative visualization framework. Linked plots with brushing, cross-filtering and pan/zoom, queried through DuckDB or DuckDB-WASM in the browser, with selections pulled back into R as a data frame.

runMosaicApp(spec = spec, specType = "json",
             data = list(df = df))

# brush in the browser, get the rows back in R
runMosaicExport(spec = spec, specType = "json",
                data = list(df = df))

RJavaScriptMosaicDuckDB-WASMShiny

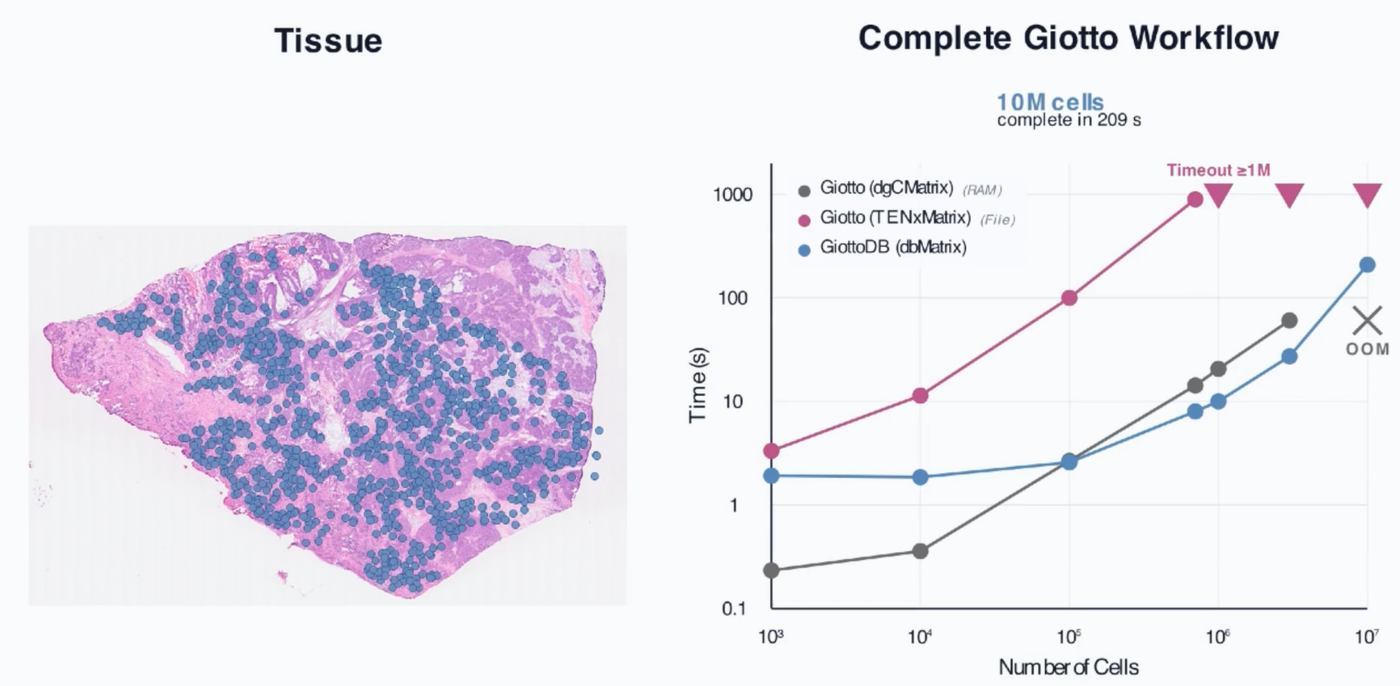
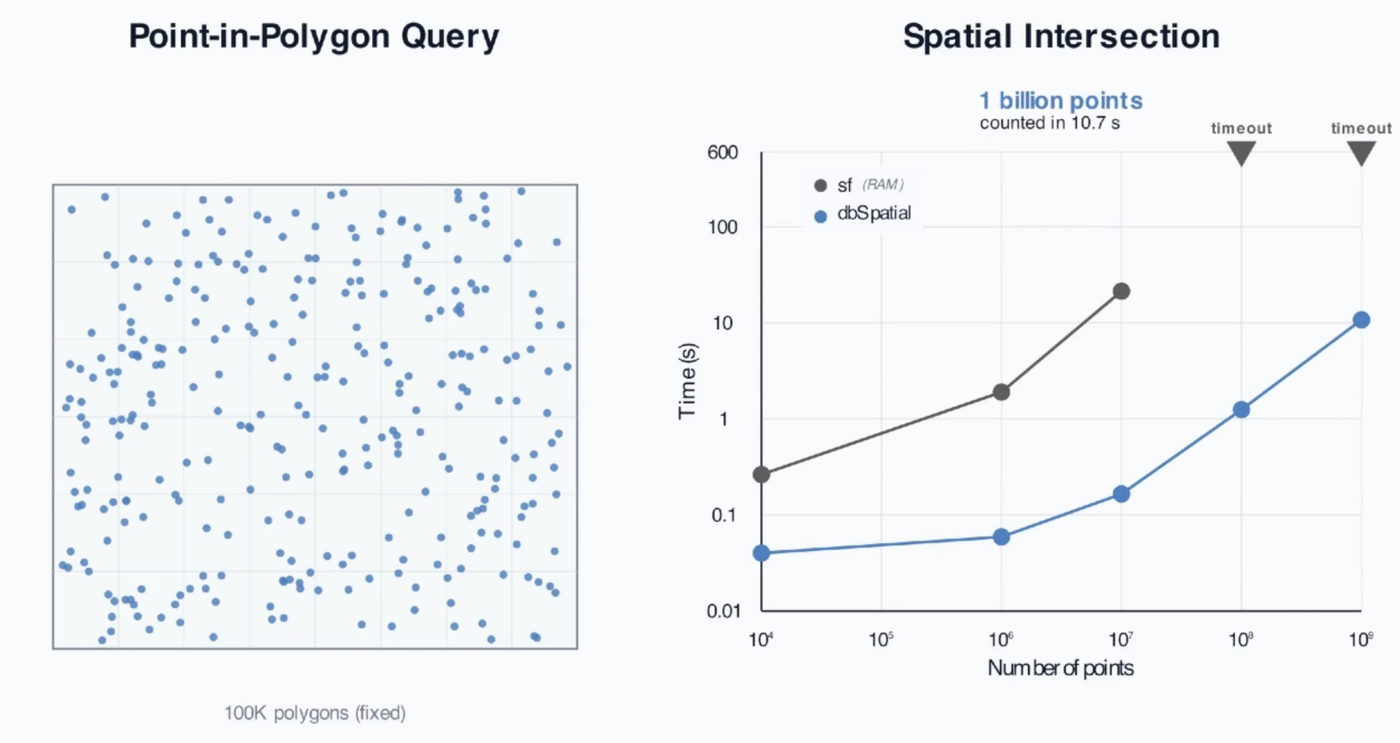
Tissue image next to a chart of runtime against number of cells for three Giotto backends; the database backend completes 10 million cells in 209 seconds Point-in-polygon query diagram next to a chart of spatial intersection time against number of points; 1 billion points counted in 10.7 seconds

Benchmark panels: a complete analysis workflow on 10 million cells, and a spatial intersection over 1 billion points.

Co-developer - preprint on bioRxiv

dbverse

An ecosystem of libraries for larger-than-memory scientific data analysis on embedded analytical databases. Matrices, spatial geometries and genomic intervals live in DuckDB and are used through familiar R interfaces, so millions of cells can be analyzed on an ordinary computer.

RDuckDBSQLSpatial omics

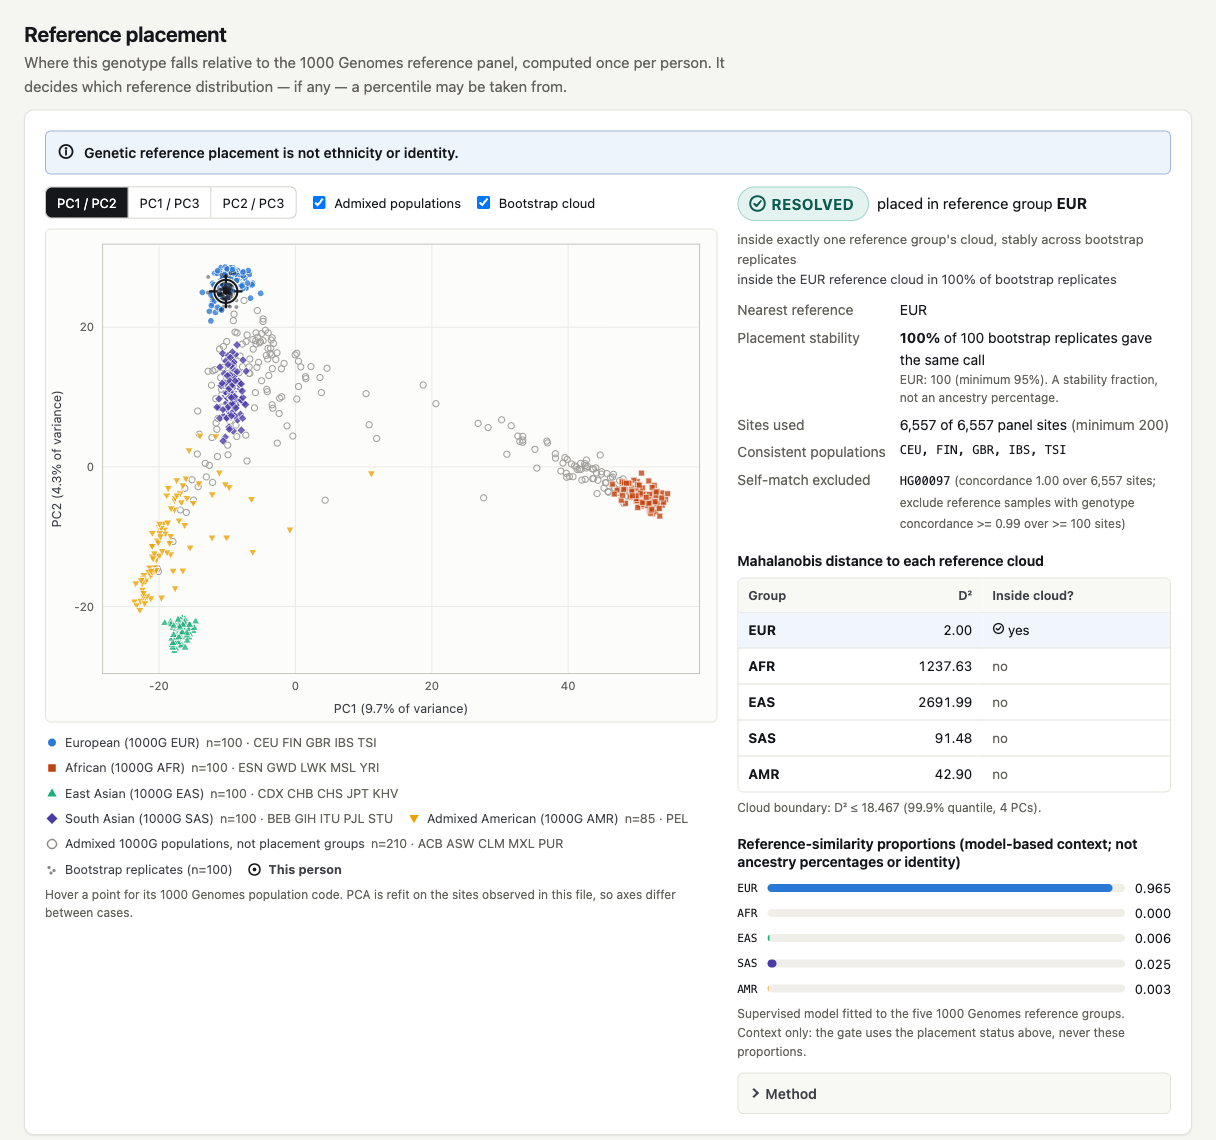
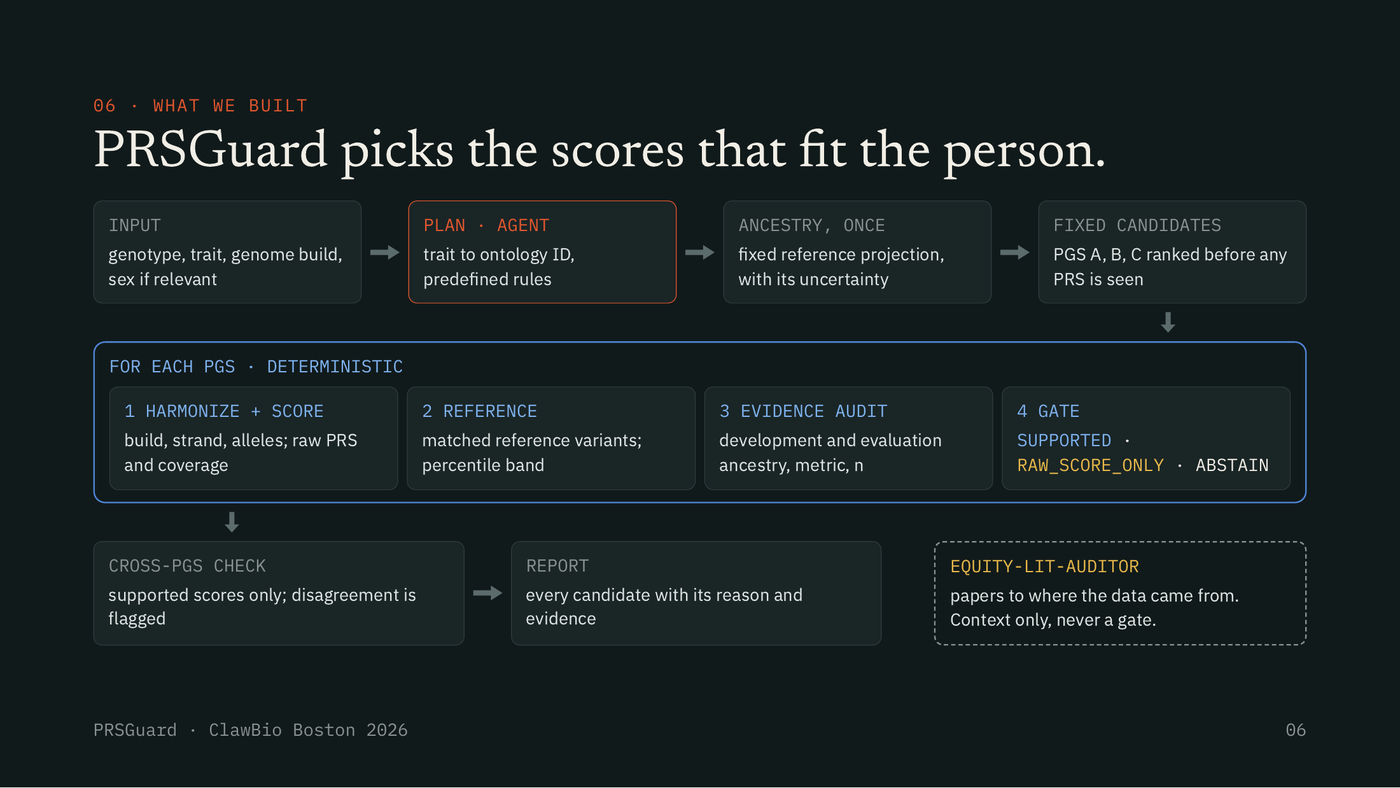
PRSGuard reference placement: a principal component plot of 1000 Genomes reference groups with this person marked inside the European cluster, placement RESOLVED as EUR, and a table of Mahalanobis distances to each reference cloud PRSGuard pipeline slide: an agent plans the run, a deterministic core harmonizes, scores, audits evidence and applies the gate for each polygenic score

The live demo on a public 1000 Genomes sample: the person is placed among the reference clusters before any percentile is released, with bootstrap stability and the distance to each cloud. Below, the pipeline from the hackathon slides.

Winner, ClawBio Hackathons: Agentic Genomics 2026 - team project

PRSGuard

Software can usually produce a polygenic risk score; whether that number can be interpreted for a given person is a separate question. PRSGuard checks the evidence behind each score and answers SUPPORTED, RAW_ONLY or ABSTAIN. An LLM agent gathers evidence and calls tools, but deterministic code alone decides what may be reported.

PythonLLM agentsPGS Catalog1000 GenomesNext.js

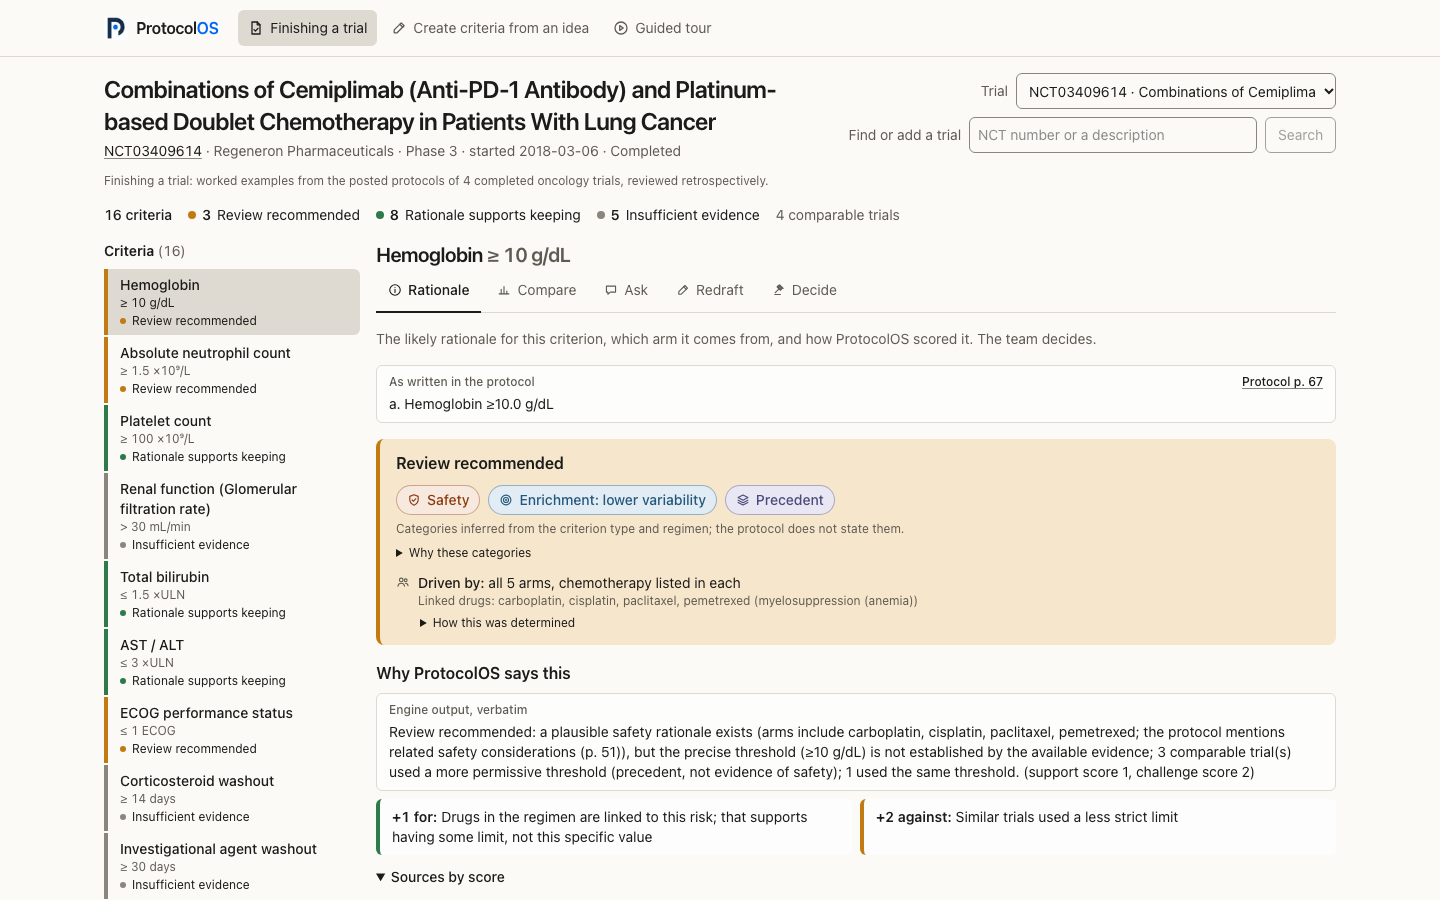
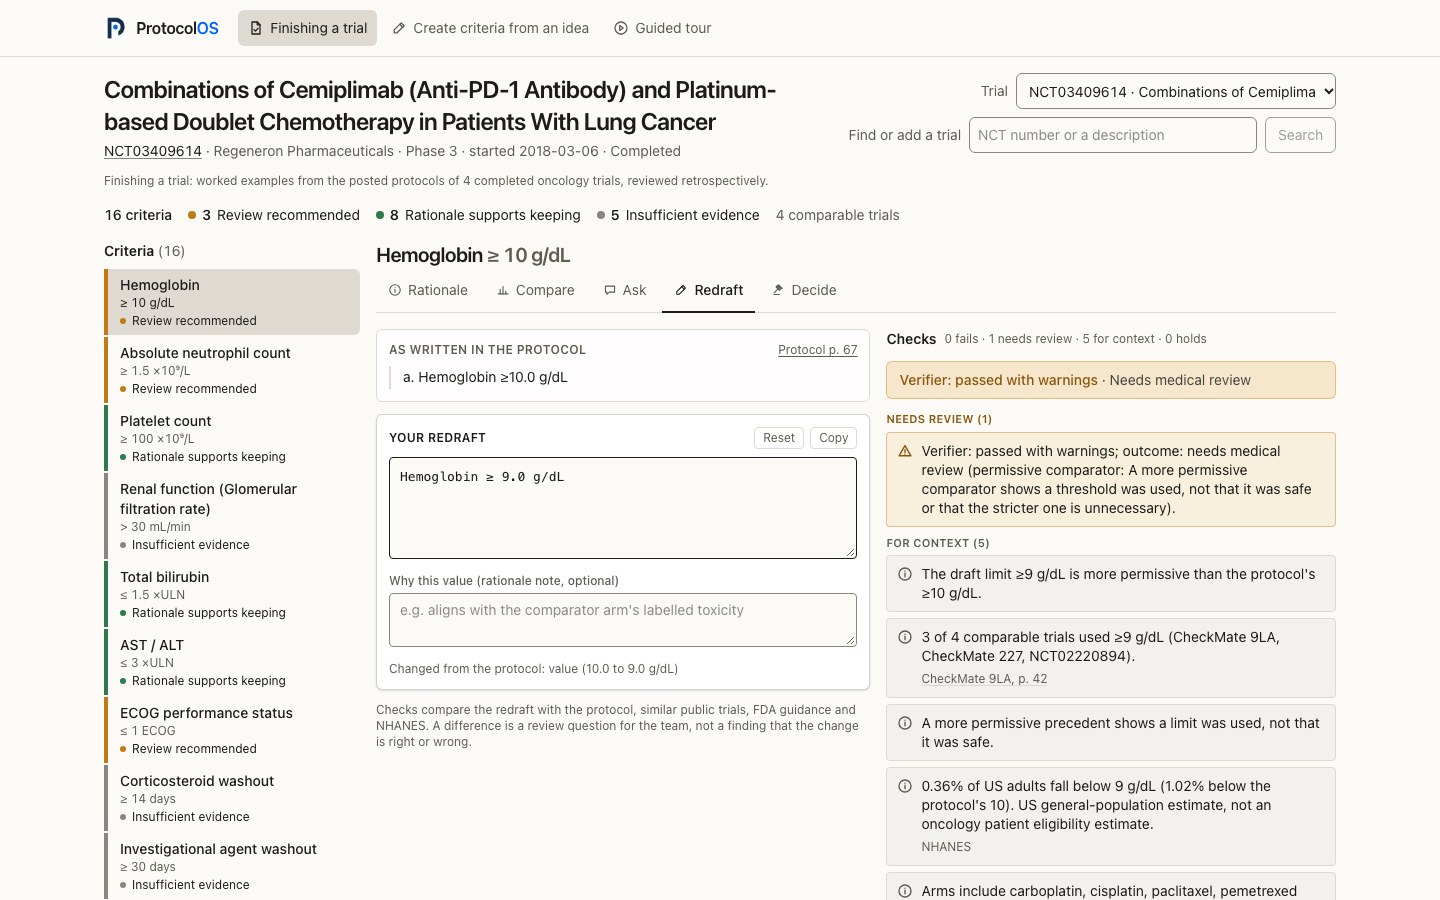
ProtocolOS review of the EMPOWER-Lung 3 protocol: a list of 16 eligibility criteria beside the hemoglobin limit, flagged Review recommended, with inferred rationale badges, the protocol line and page, and the scoring behind the result ProtocolOS redraft workspace: a hemoglobin limit lowered to 9 g/dL beside the verifier result, passed with warnings, and context from comparable trials and NHANES

The hemoglobin limit of EMPOWER-Lung 3 in the live app: the likely rationale and how it was scored, then a redraft to 9 g/dL checked as you type. A research prototype, not clinical or regulatory advice.

Second place, HackHarvard 2026 Healthcare track - team project

ProtocolOS

Eligibility criteria decide who may join a cancer trial, and they are often carried forward from earlier protocols without a written reason. ProtocolOS shows the likely rationale behind each criterion, compares it with earlier trials and FDA guidance, and checks every proposed change with a deterministic verifier.

PythonFastAPINext.jsLLM agentsClinicalTrials.gov

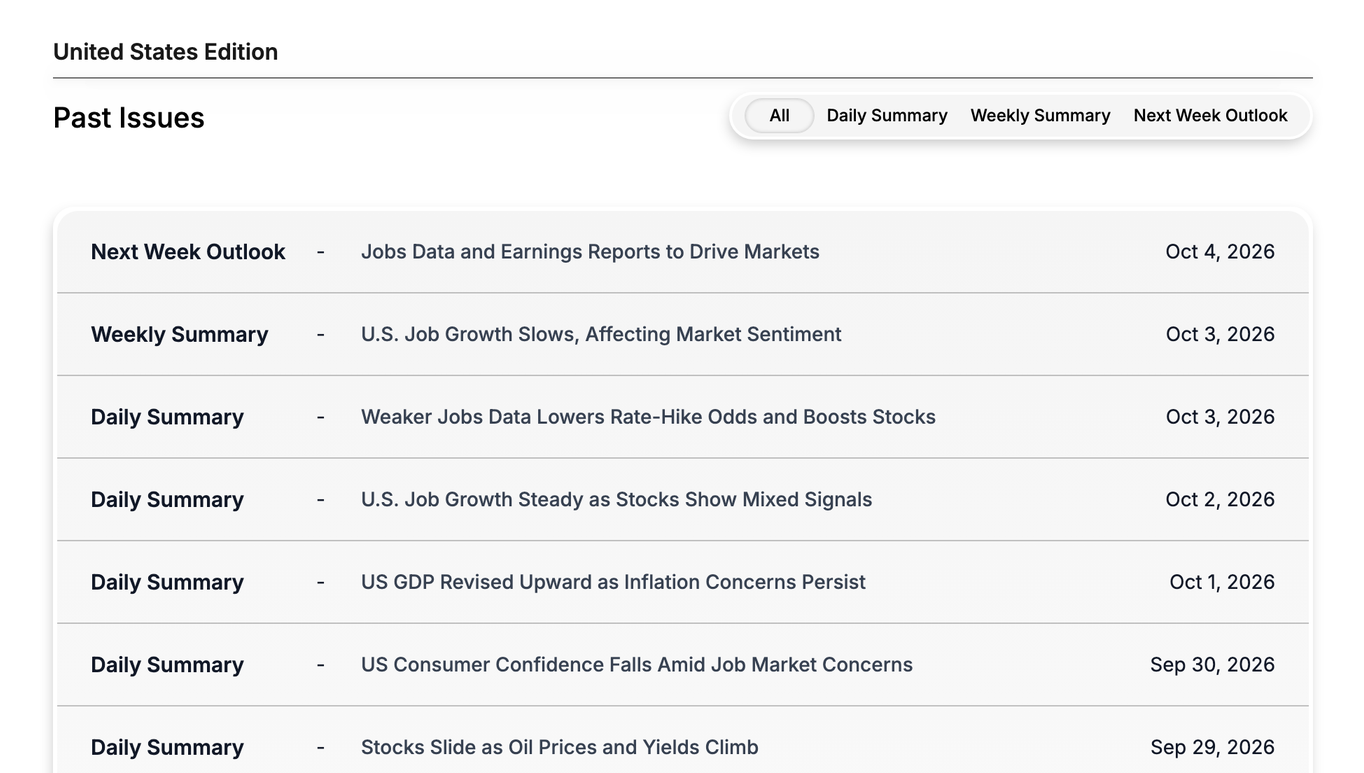
MacroGlide newsletter archive listing daily summaries, weekly summaries and next-week outlooks

The public archive of the United States edition.

Co-founder and CTO, MacroGlide

MacroGlide Newsletter

An automated financial newsletter platform: multi-source data acquisition, agentic news selection and writing with automated quality scoring, and its own email delivery infrastructure. Daily US, EU and Asia editions, with 5,000+ subscribers.

TypeScriptNestJSPythonPostgreSQLLLM agents

Current research

Machine learning for protein electron transfer Bravaya Lab, Boston University

I train deep-learning models that predict electronic couplings between protein residues in seconds instead of running a quantum-chemistry calculation for every pair. They are trained on 270,000+ Q-Chem calculations across 38 residue-pair types, and combined with Marcus-theory energetics in a development version of the lab's eMap software.

With the Elliott group I built a screening pipeline (sequence clustering, genome-neighborhood filtering, AlphaFold 3 modeling, electron-transfer analysis) that narrowed 18,000+ bCcP-superfamily sequences to 11 candidate MauG-like enzymes for experimental characterization. I presented it as a poster at ACS Fall 2026, where I received the Outstanding Research Award of the Division of Computers in Chemistry.

Publications and manuscripts